Contact us, book a demo or try our offerings for free.

Attain your goals
Align your workforce
motivate your team
Foster a culture of alignment and purpose, where every employee is motivated to contribute to the company’s shared vision—your most valuable asset..
Register now!
Take the first step toward achieving your goals today. Sign up now for instant access—no credit card required!
Register Align your team on common goals: Achieve organizational harmony by ensuring every team member understands their role in driving the company toward shared objectives. |  Cultivate a culture of collaboration and accountability: Build a transparent, supportive environment where teamwork, shared responsibility, and success go hand in hand, driving lasting improvement. |  Gain actionable insights into performance: Empower your decision-making with clear, data-driven insights that identify the factors driving results and pinpoint areas for improvement. |  Encourage healthy benchmarking: Promote constructive comparisons and benchmarking within teams to inspire growth, accountability, and a spirit of continuous improvement. |




Stay focused
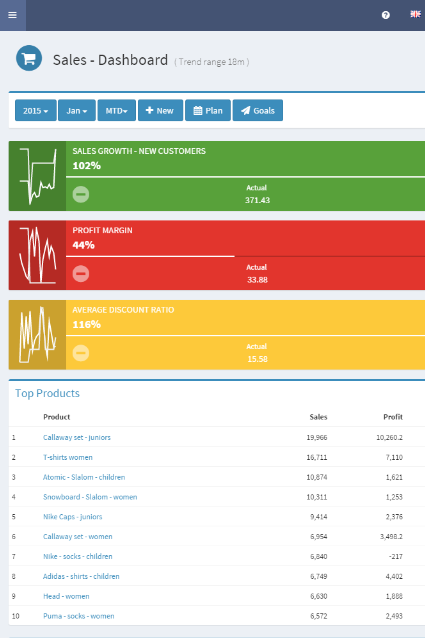
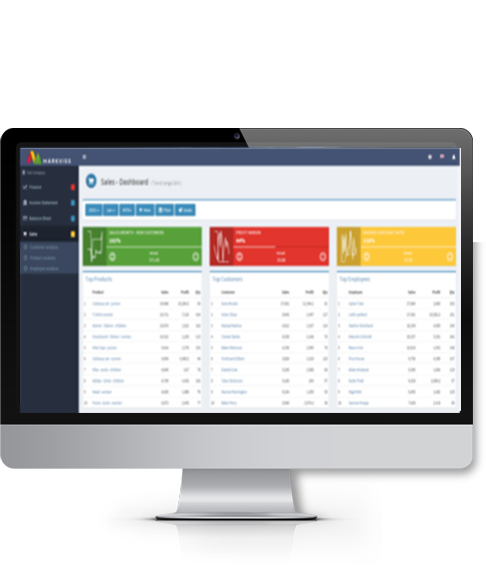
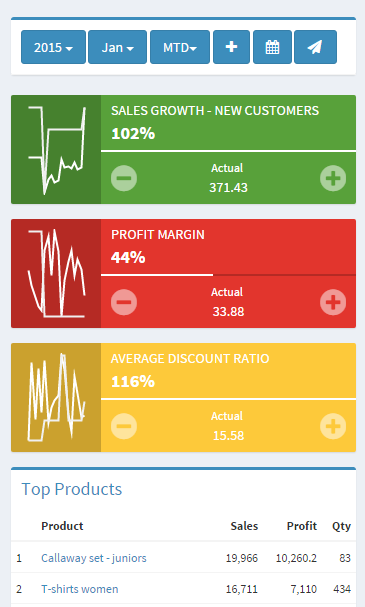
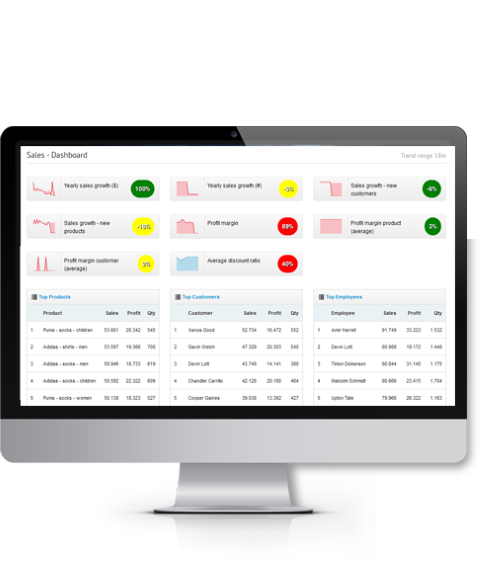
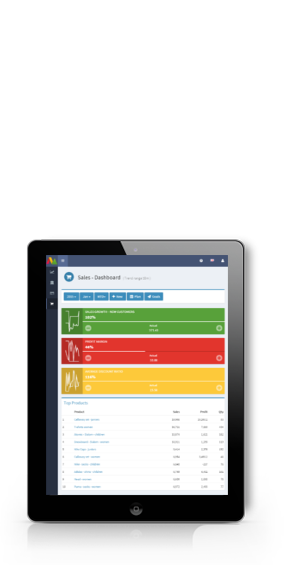
Create strategic dashboards that highlight your most important goals
Our intuitive design helps your team to stay focused on the most important goals and actions. Shared across the entire company, they ensure alignment and keep your workforce on track to achieve success together.
-
Want to know more?
-
Want to partner with us?
We are always looking to enhance our network in all industries and all corners of the world
Always with you
No upfront cost
Our solution is fully hosted, eliminating the need for any software or hardware investment. Set your goals, track them anywhere, and only pay for what you actually use.


